Erick Bautista

Data Analytics & Business Intelligence Portfolio
Erick Bautista - Portfolio
Project 1: Data Analytics & Business Intelligence Portfolio
Developed interactive Tableau dashboards to analyze sales, profitability, and customer segmentation across multiple regions.
• Built dashboards for sales analysis in the USA and EU.
• Created visualizations to analyze customer segmentation in the UK.
• Designed charts and maps to highlight trends and performance.
Technologies: Tableau, SQL, Excel.
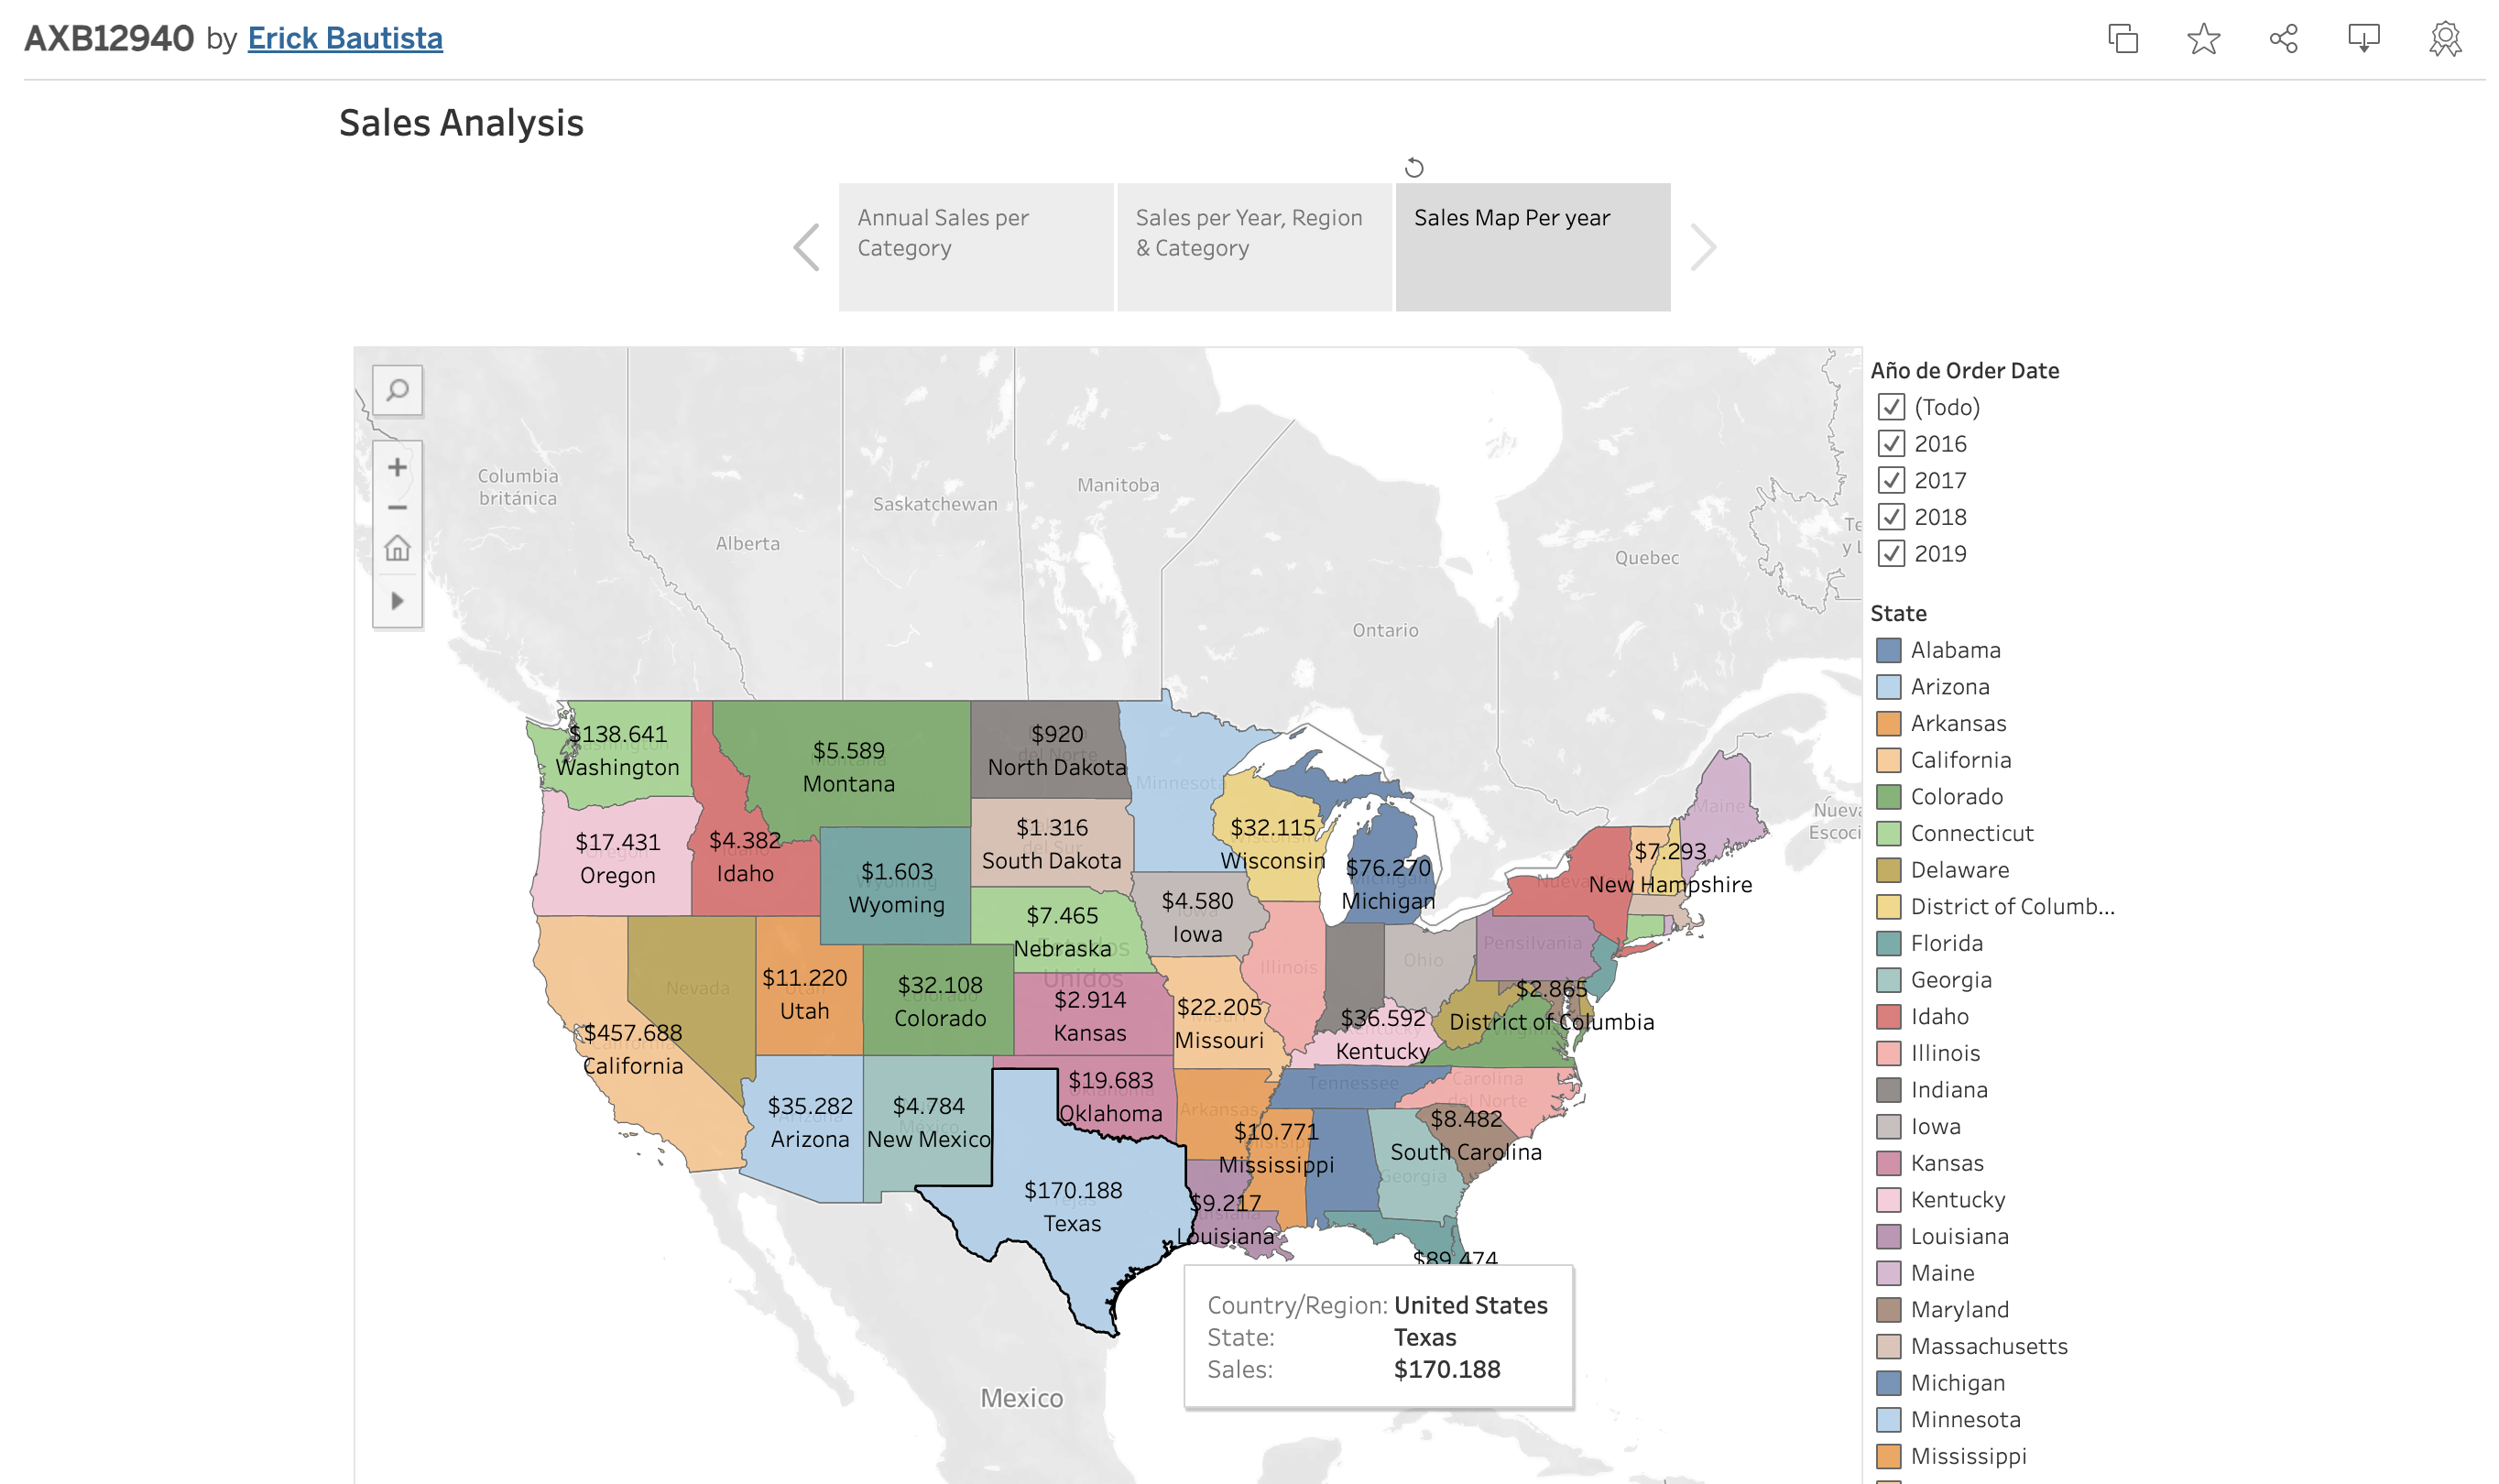
1. Sales Analisis in the USA. see on Public Tableau
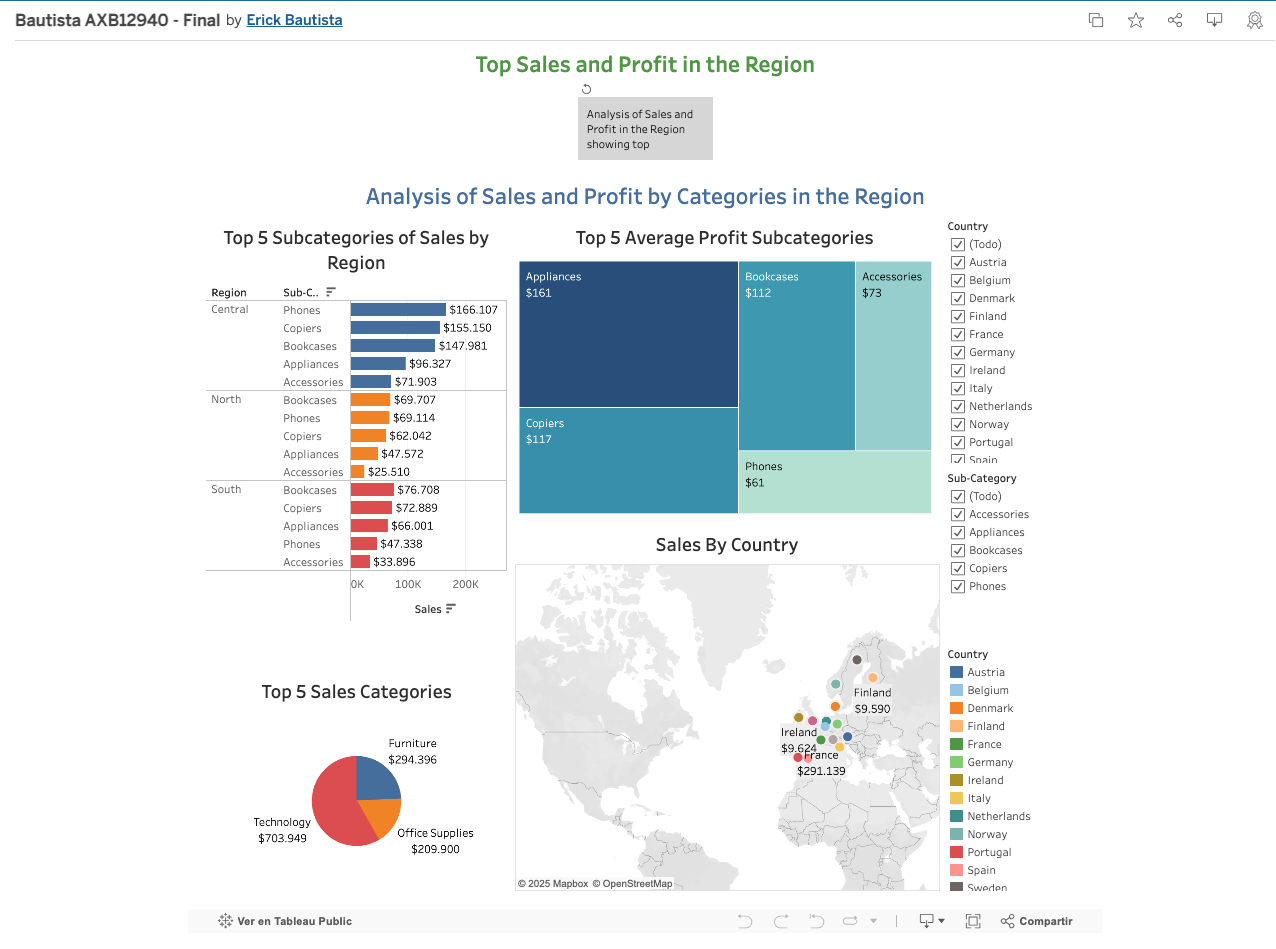
2. Analysis of Sales and Profitability in EU. see on Public Tableau
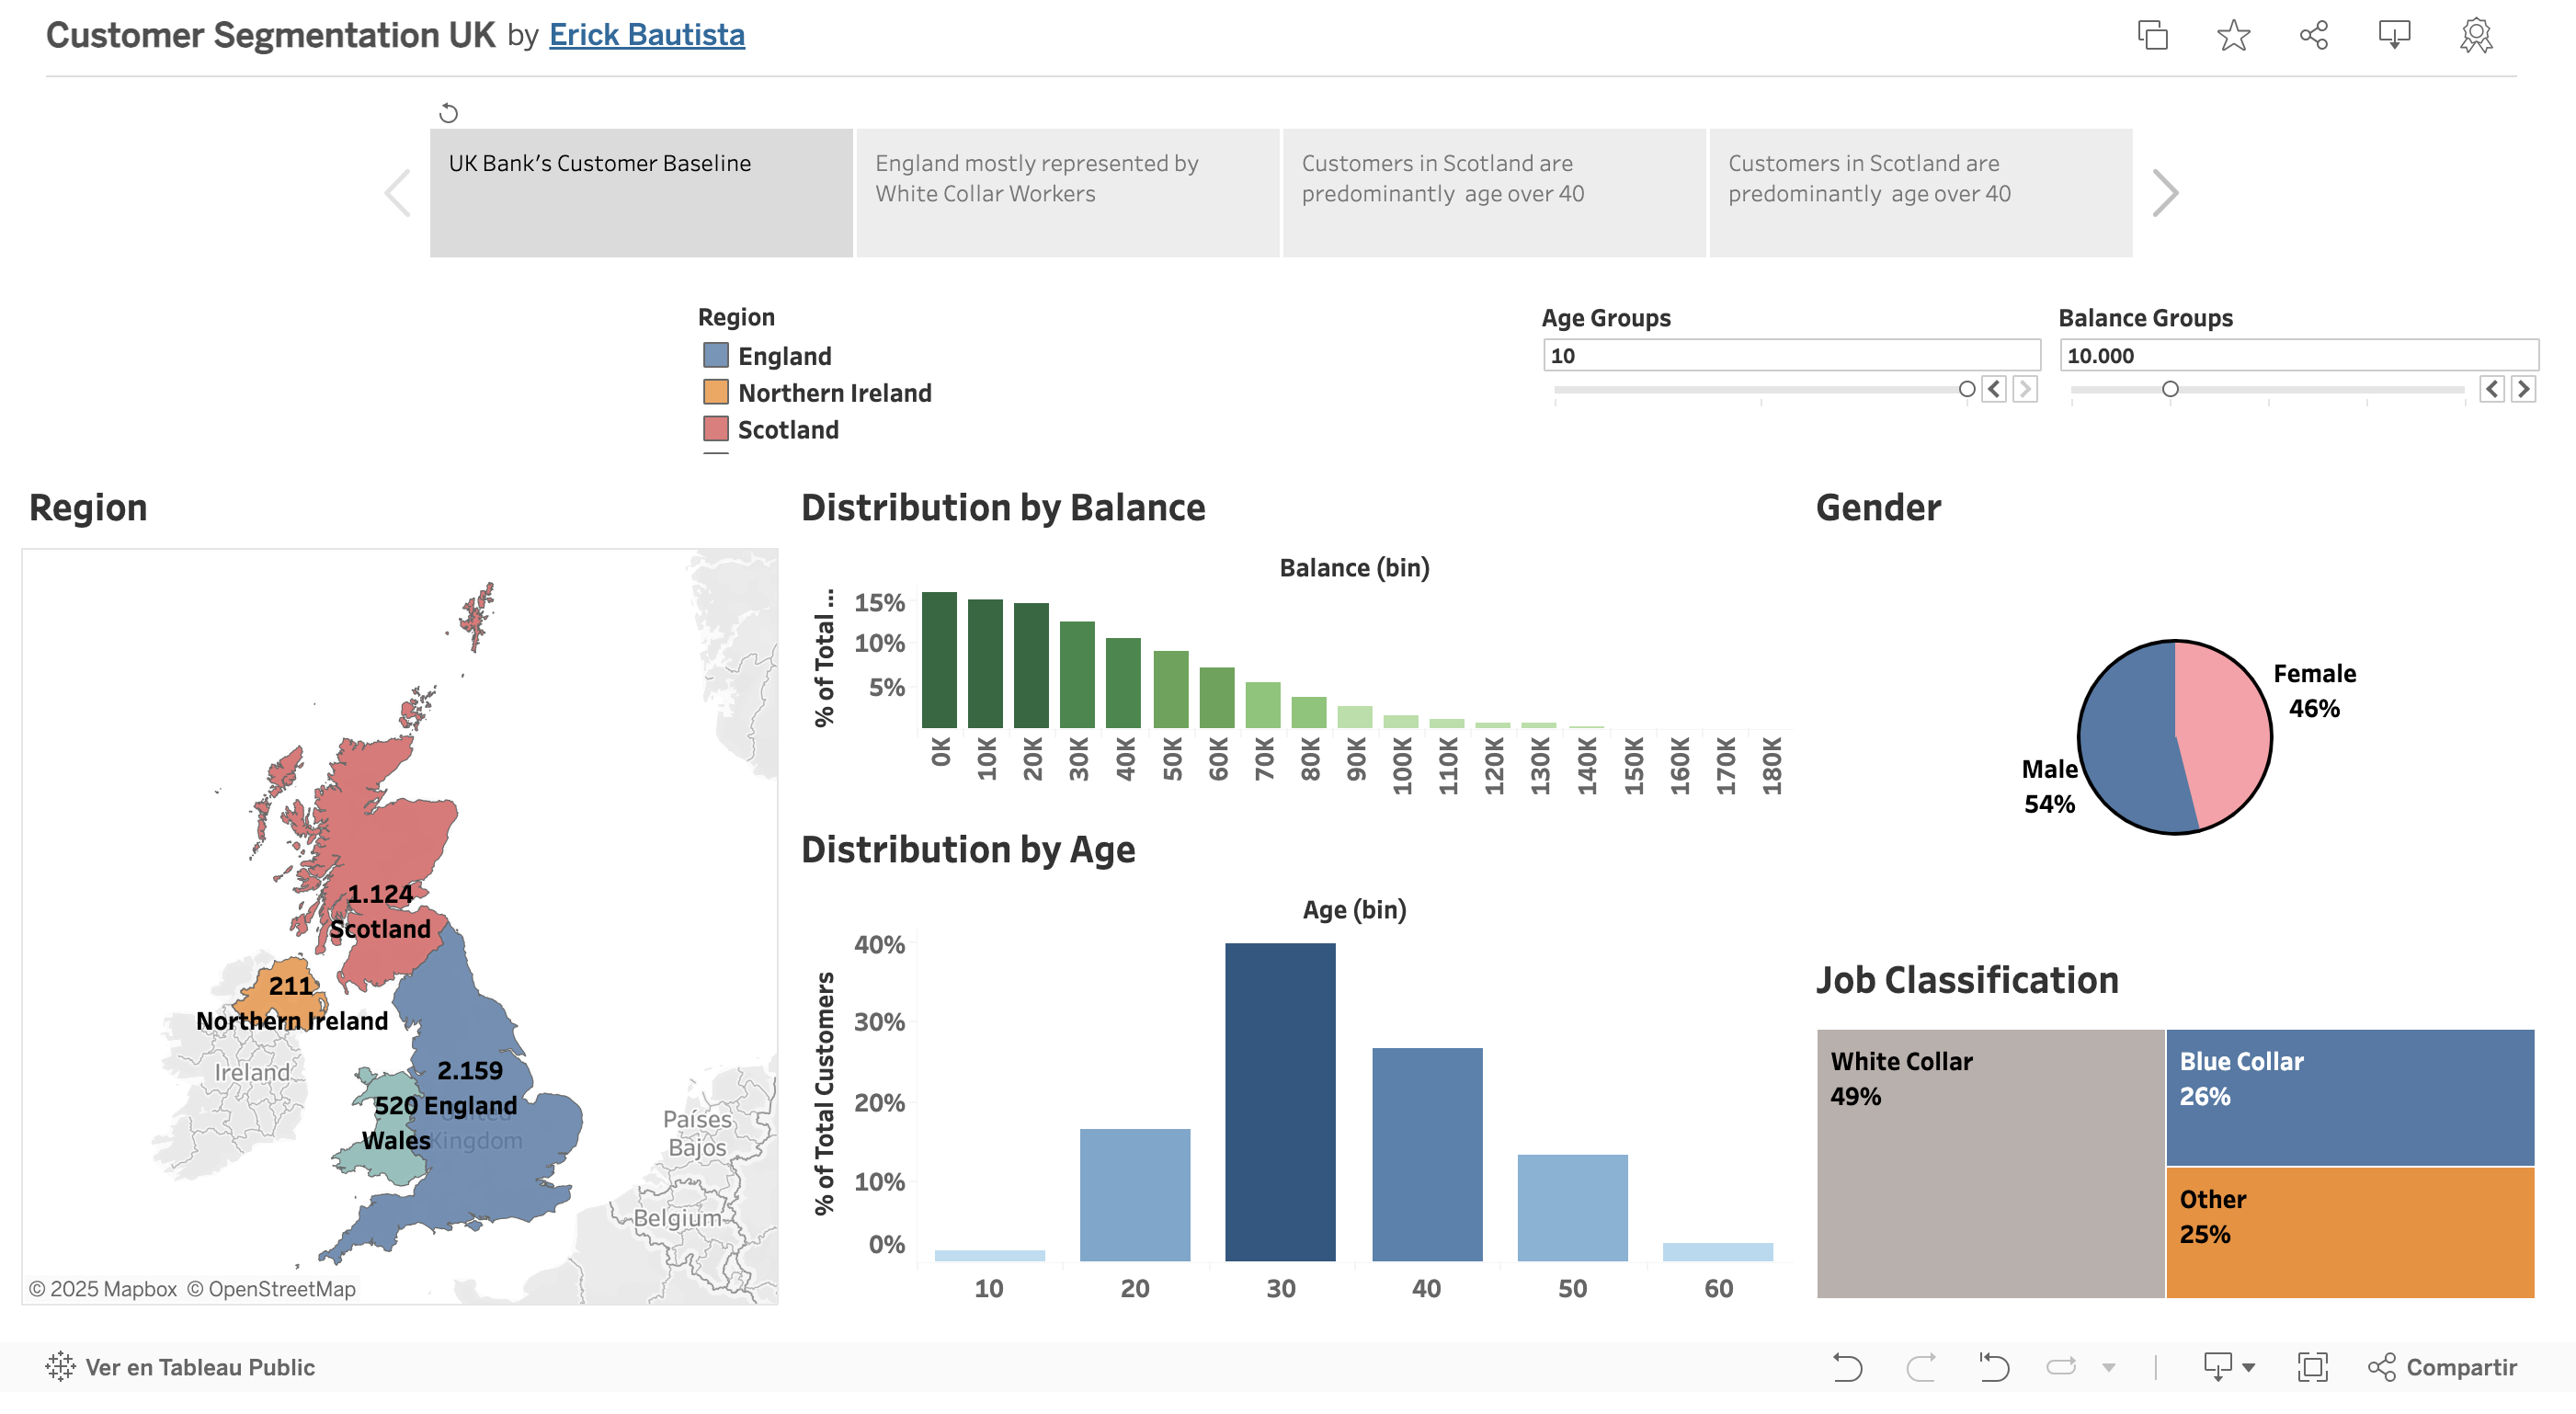
3. Customer Segmentation in the UK. see on Public Tableau
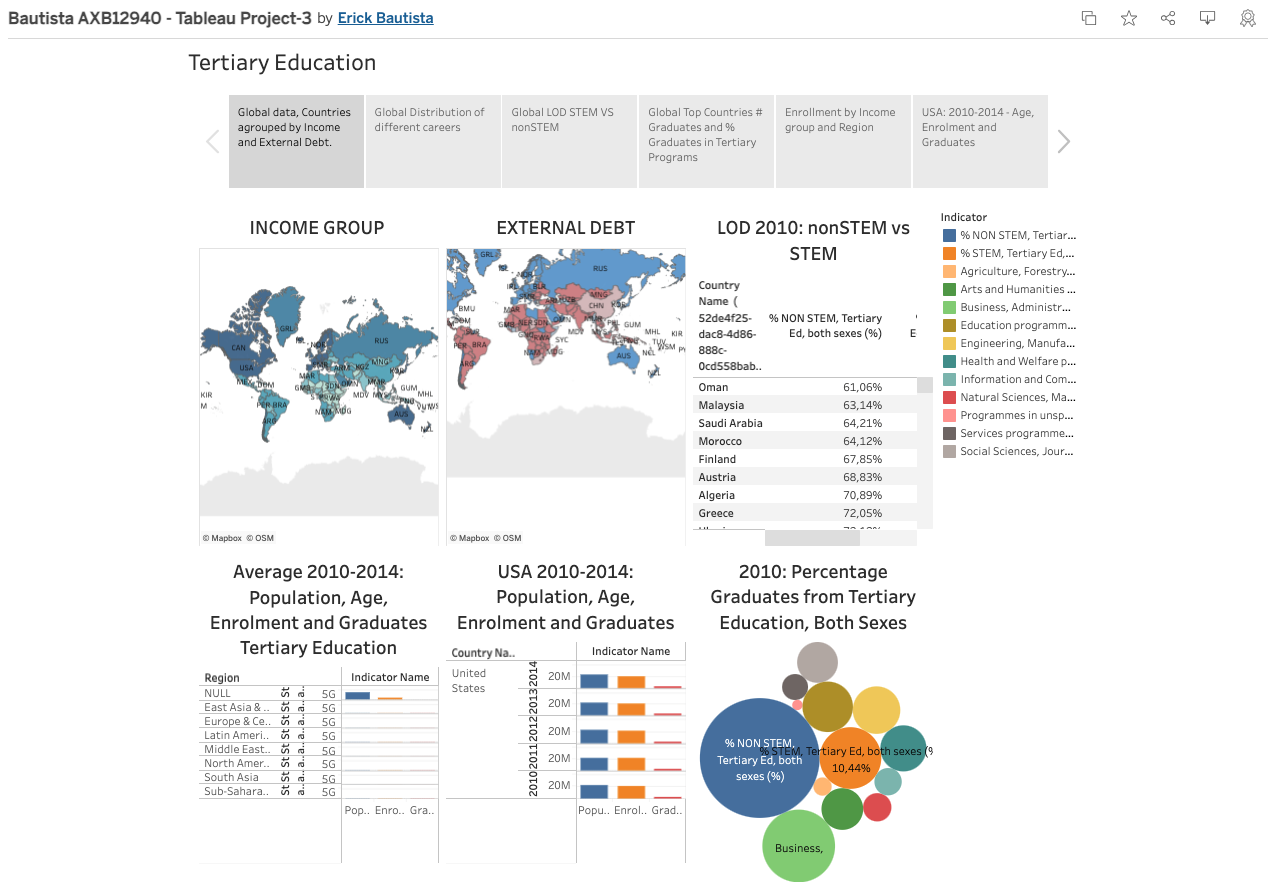
4. World Tertiary Education, STEM vs non STEM. see on Public Tableau
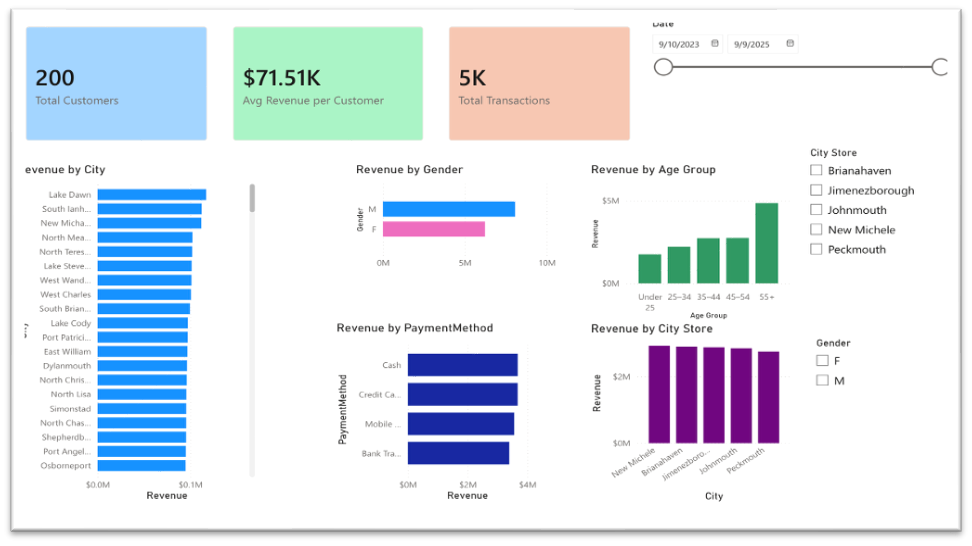
5. Analysis of Sales and Profitability. see on Power BI
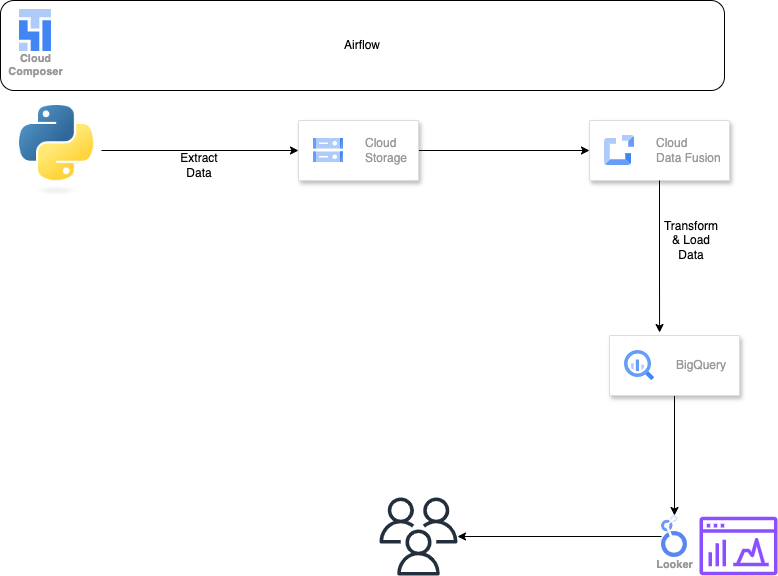
Project 2: Data Pipeline & Analytics on GCP
Built an end-to-end analytics pipeline on Google Cloud to generate, transform, and load data into BigQuery and support reporting and analysis.
• Generated synthetic data using Python.
• Built ETL pipelines using Google Data Fusion.
• Loaded data into BigQuery and performed SQL queries.
• Created dashboards in Looker for reporting.
Technologies: Python, SQL (BigQuery), Google Data Fusion, Looker.
WorkFlow
- Project Design: Draw.io
- Data Generation: Python code
- ETL: GCP Enviroment, Instance, Data Fusion, Pipeline, Big Query
- Data Visualization: Looker
Design
Python Code Snippet: Data Loading
import csv
from faker import Faker
import pandas as pd

fake = Faker()

def sanitize_text(text):
    """Removes newlines, extra spaces, and ensures proper formatting."""
    return text.replace('\n', ' ').replace('\r', ' ').replace(',', ' ').strip()


def generate_employee_data(num_employees=1000):
    with open("cleaned_employee_data.csv", "w", newline="", encoding="utf-8") as csvfile:
        fieldnames = [
            "employee_id", "first_name", "last_name", "email", "phone_number", "address", "birthdate",
            "hire_date", "job_title", "department", "salary", "password"
        ]
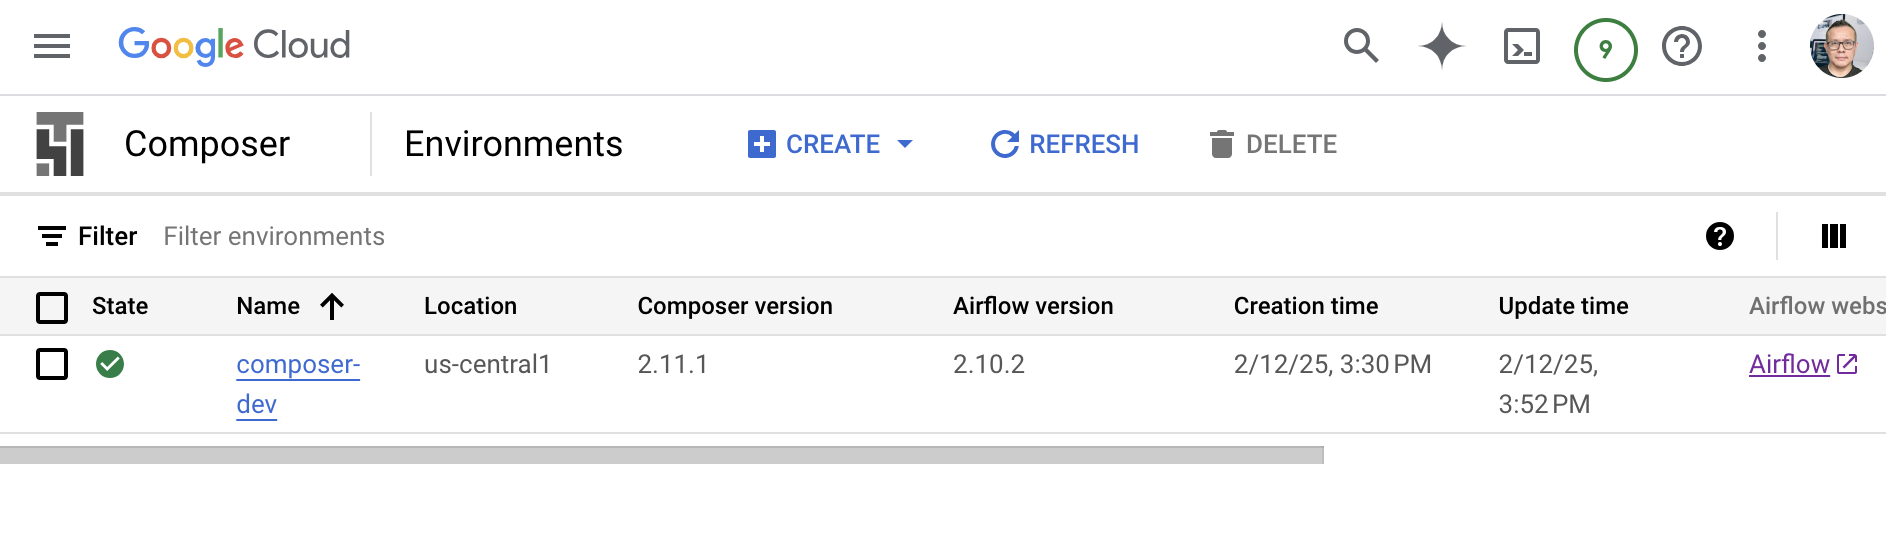
GCP Composer
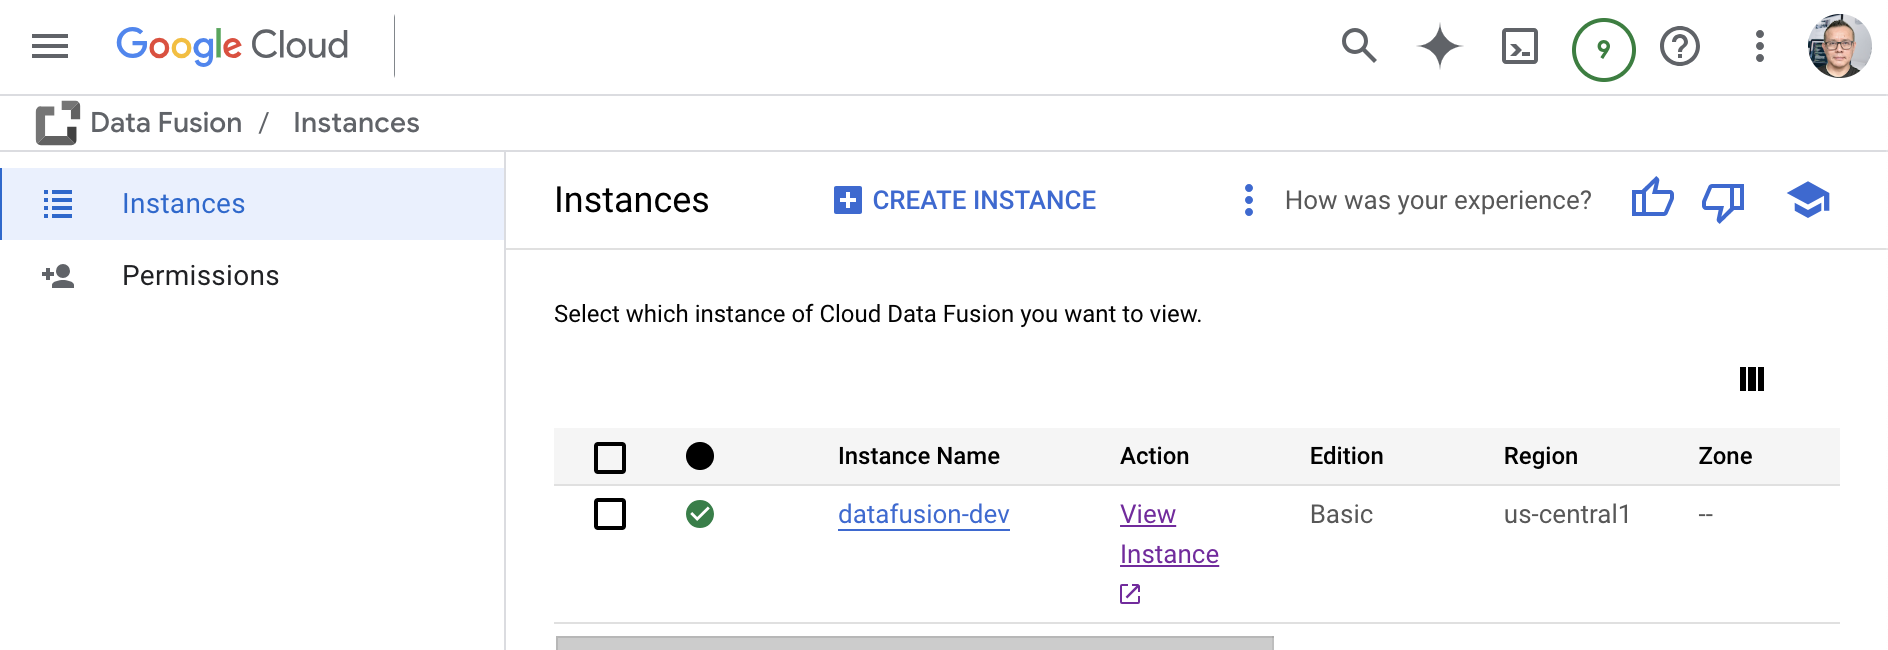
GCP Instances
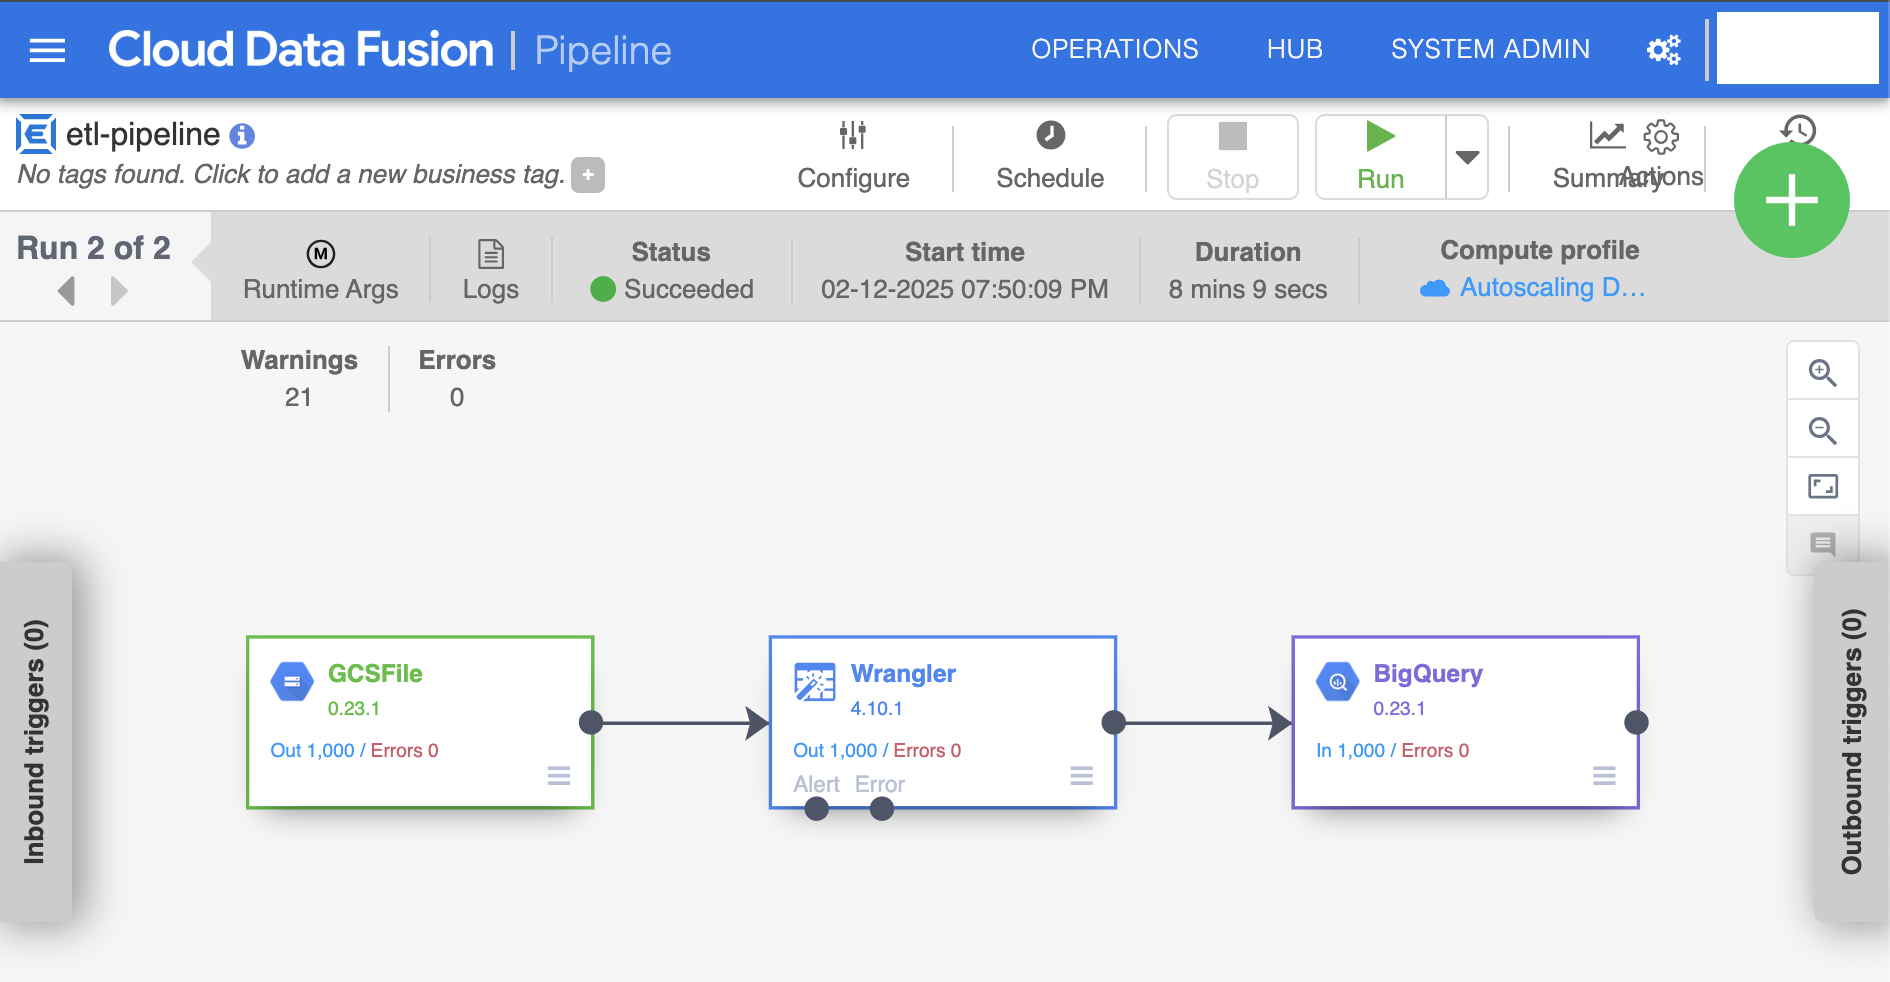
GCP Data Fusion Pipeline
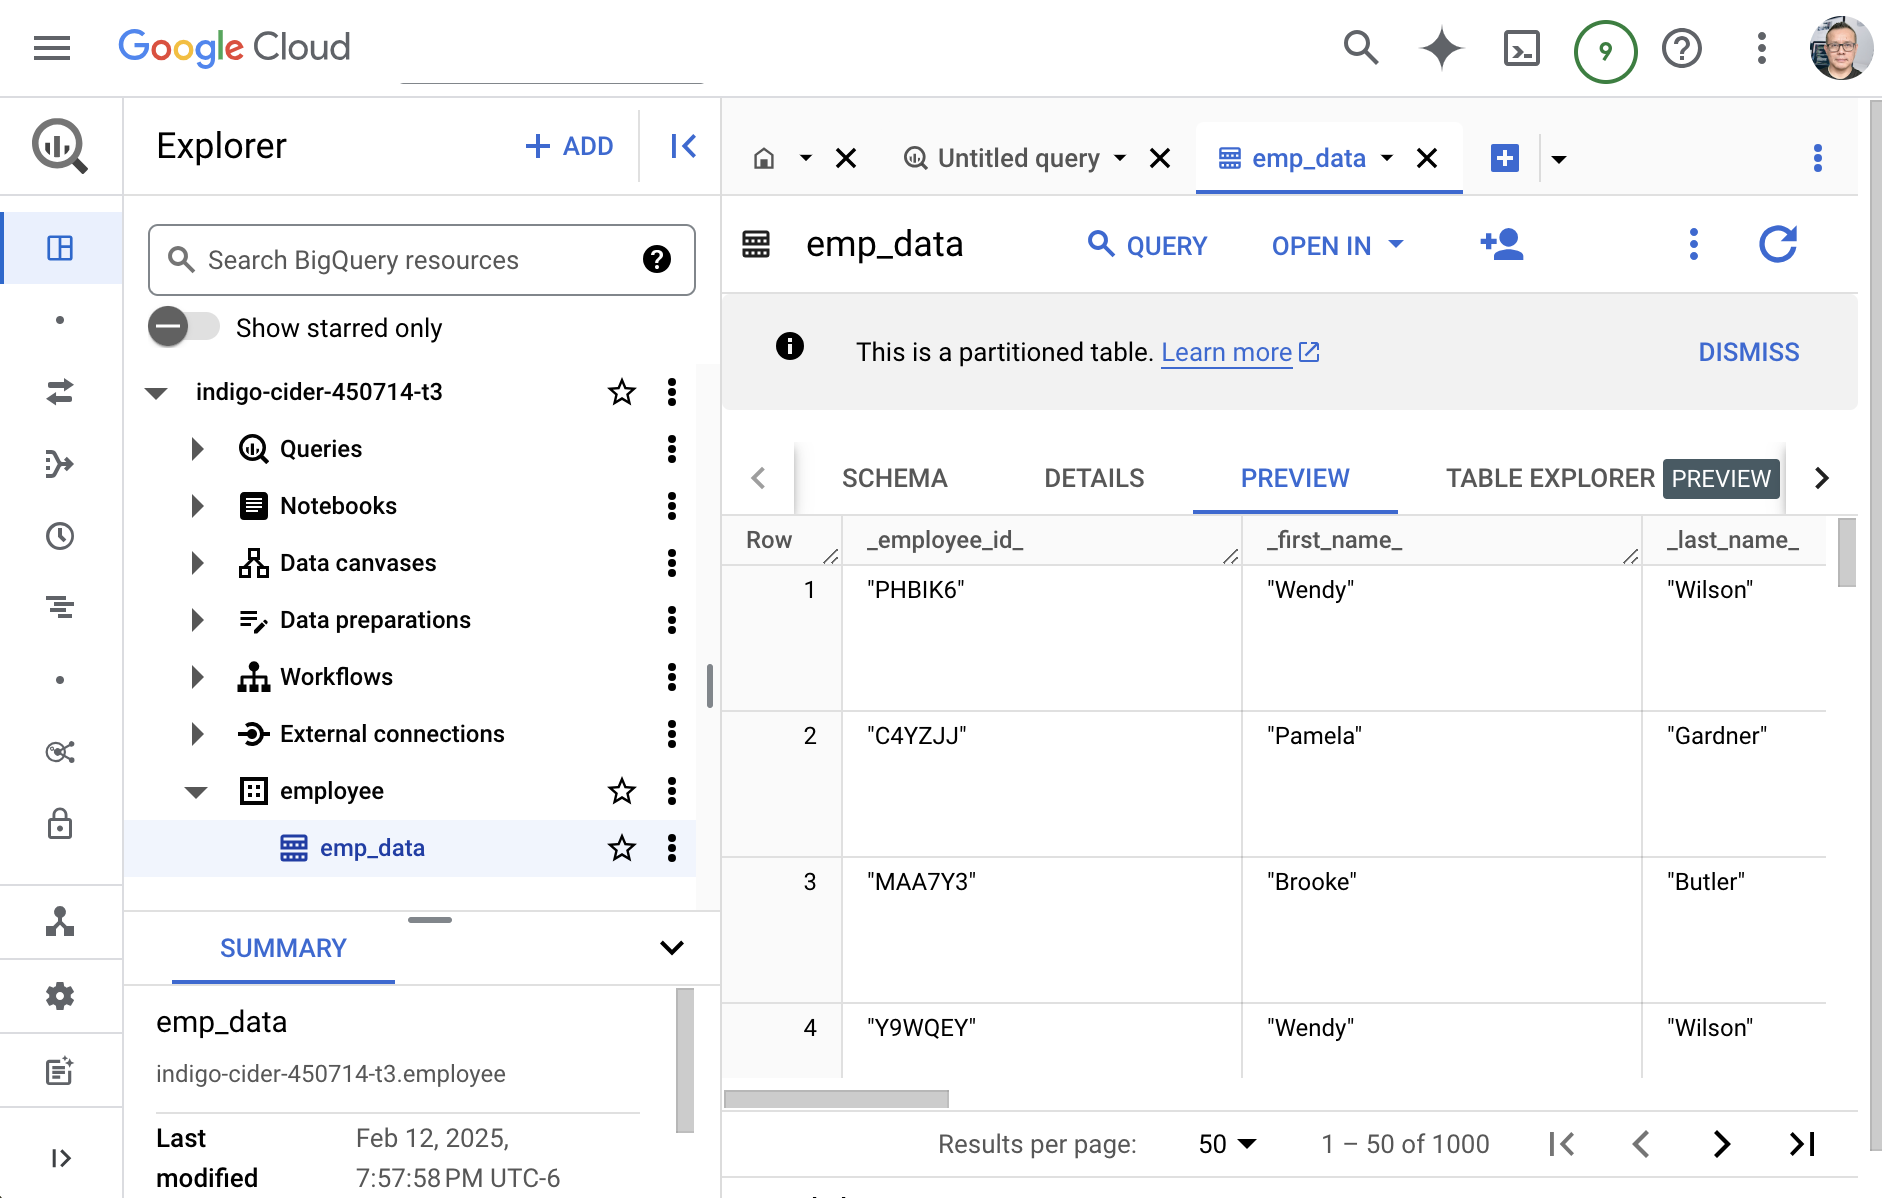
GCP Big Query
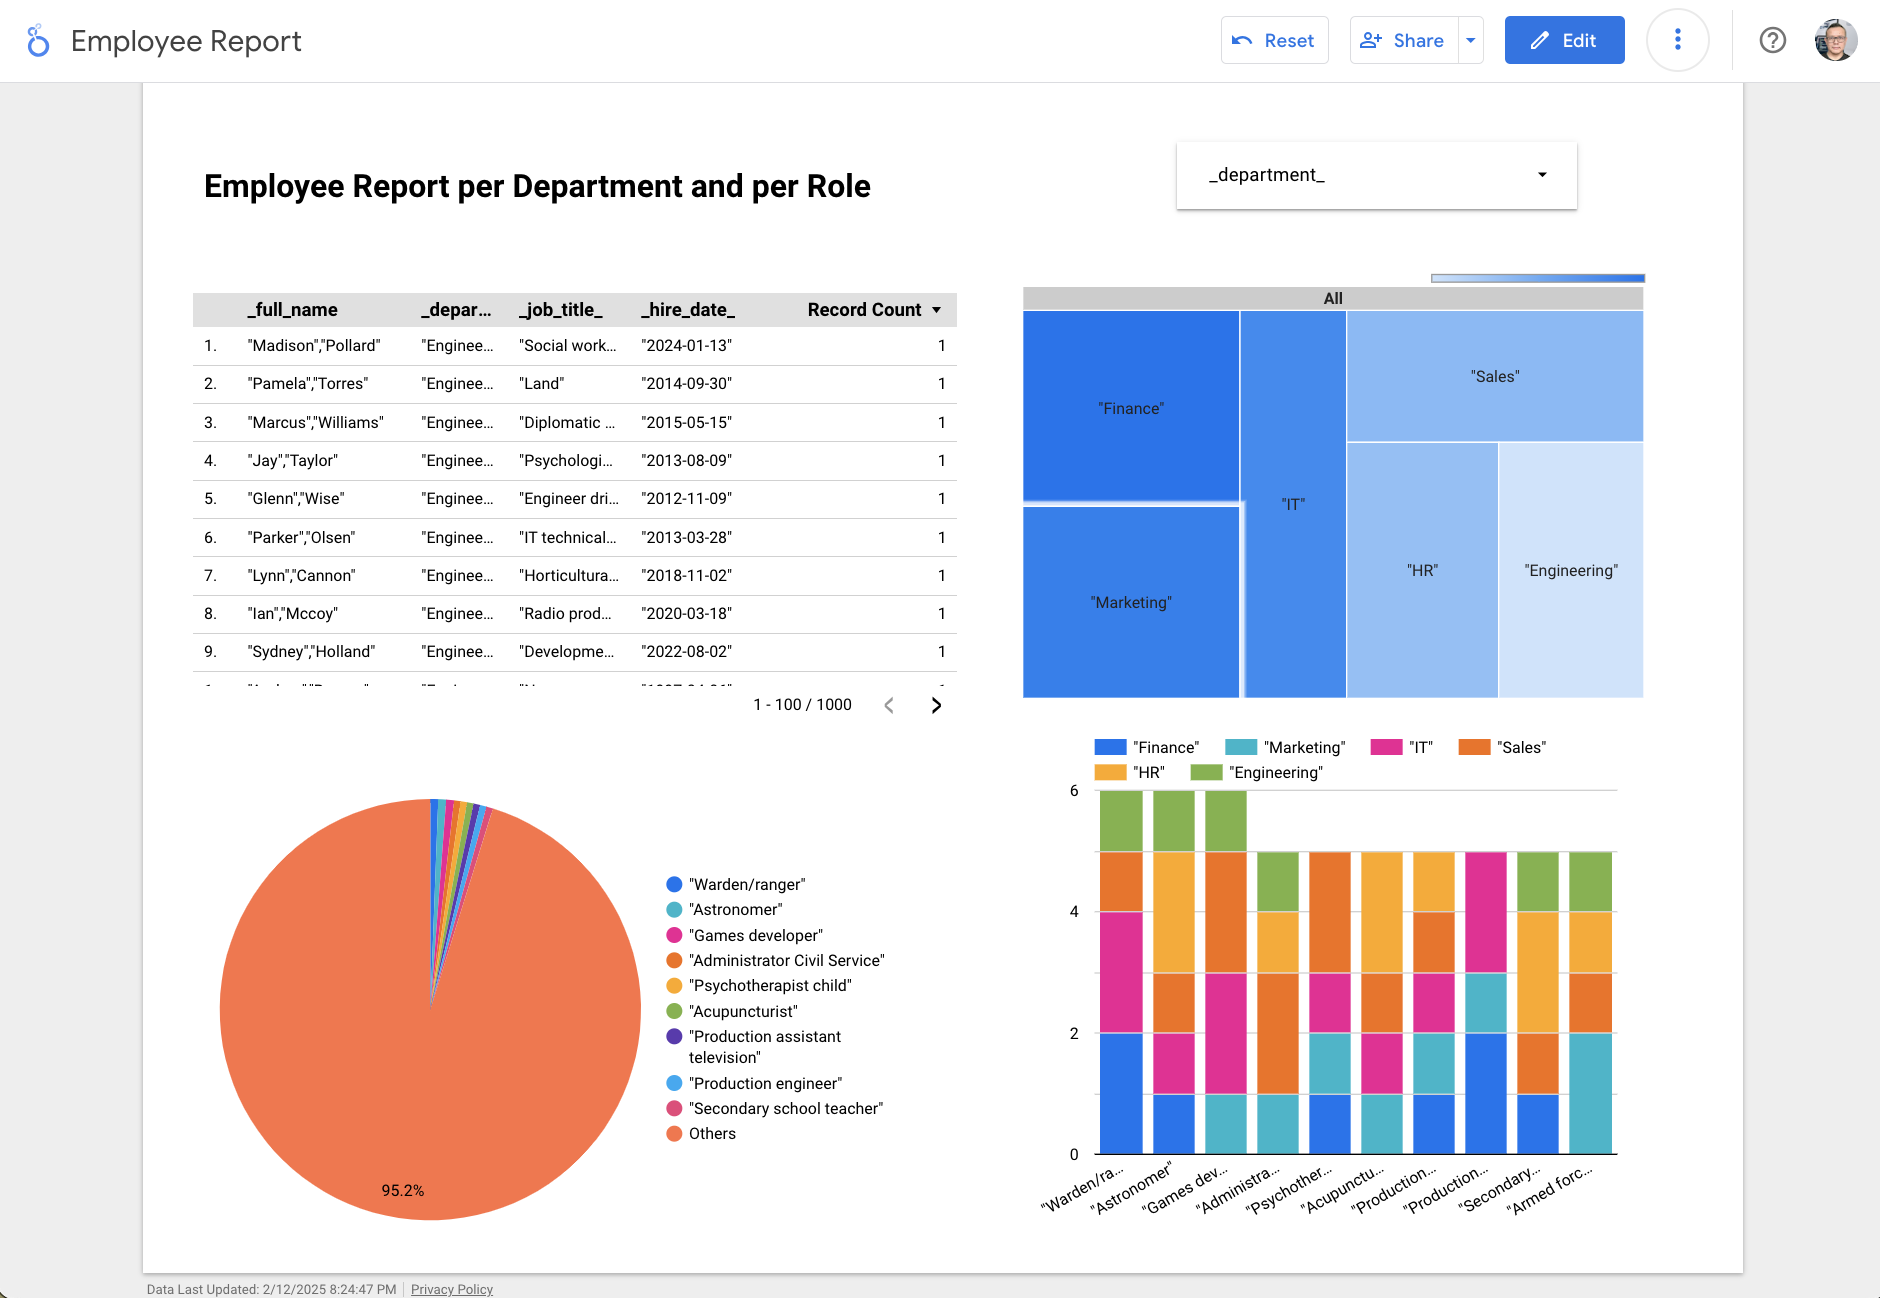
GCP Looker
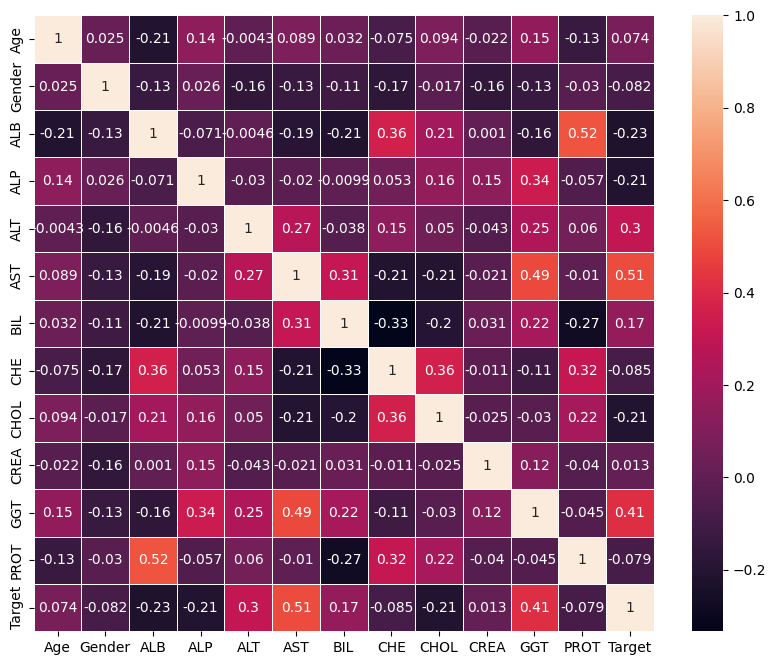
Project 3: Predictive Analytics with PySpark
Performed data preparation and built a predictive analytics model using PySpark to identify patterns in laboratory data.
• Cleaned and transformed data.
• Performed feature engineering.
• Built and evaluated a predictive model.
Technologies: PySpark, Python, Machine Learning (Linear Regression), Pandas, NumPy, Matplotlib.
WorkFlow
- Data Prep
- Feature Engineering
- Build Model
- Evaluate
Feature Engineering
- Numberical Values
- Vectorization
- Scaling
Google Colab code snippet: Pyspark Session
!pip install pyspark

# Load our Pkgs
from pyspark import SparkContext

# Spark
spark = SparkSession.builder.appName("MLwithSpark").getOrCreate()

# Load our dataset
df = spark.read.csv("/content/drive/MyDrive/Colab Notebooks/Data/hcvdata.csv",header=True,inferSchema=True)
Google Colab code snippet: Logistic Model
train_df,test_df = vec_df.randomSplit([0.7,0.3])
from pyspark.ml.classification import LogisticRegression,DecisionTreeClassifier

# Logist Model
lr = LogisticRegression(featuresCol='features',labelCol='Target')
lr_model = lr.fit(train_df)
y_pred = lr_model.transform(test_df)
y_pred.show()
y_pred.select('target','rawPrediction', 'probability', 'prediction').show()
Google Colab code snippet: Model Evaluation
from pyspark.ml.evaluation import MulticlassClassificationEvaluator

# How to Check For Accuracy
multi_evaluator = MulticlassClassificationEvaluator(labelCol='Target',metricName='accuracy')
multi_evaluator.evaluate(y_pred)
from pyspark.mllib.evaluation import MulticlassMetrics
lr_metric = MulticlassMetrics(y_pred['target', 'prediction'].rdd)

print("Accuracy",lr_metric.accuracy)
print("Precision",lr_metric.precision(1.0))
print("Recall",lr_metric.recall(1.0))
print("F1Score",lr_metric.fMeasure(1.0))
Heatmap
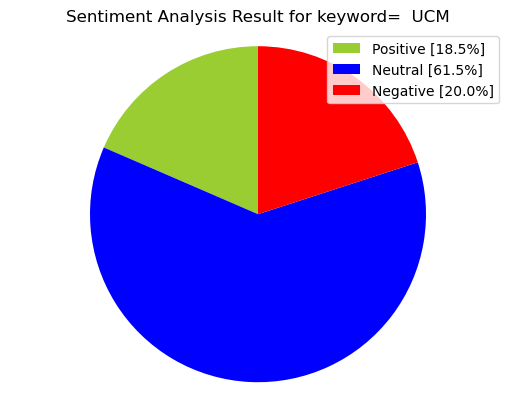
Project 4: Text Analytics & Sentiment Analysis
Collected social media data using APIs and performed text analytics and sentiment analysis to identify trends.
• Extracted and cleaned text data.
• Classified sentiment as positive, negative, or neutral.
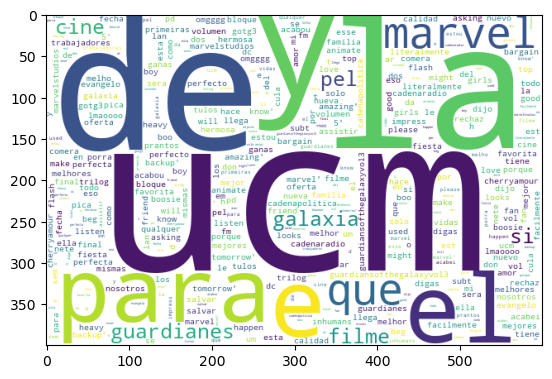
• Visualized results.
Technologies: Python, Tweepy, TextBlob, Pandas, Matplotlib.
WorkFlow
- Preparation: textblob, tweepy, pycountry, wordcloud, langdetect
- Authentication for Twitter API
- Getting Tweets With Keyword or Hashtag
- Extracting text values
Google Colab code snippet: Authentication for Twitter API
auth = tweepy.OAuthHandler(consumerKey, consumerSecret)
auth.set_access_token(accessToken, accessTokenSecret)
api = tweepy.API(auth)
Google Colab code snippet: Getting Tweets With Keyword or Hashtag
for tweet in tweets:

    #print(tweet.text)
    tweet_list.append(tweet.text)
    analysis = TextBlob(tweet.text)
    score = SentimentIntensityAnalyzer().polarity_scores(tweet.text)
    neg = score['neg']
    neu = score['neu']
    pos = score['pos']
    comp = score['compound']
    polarity += analysis.sentiment.polarity
Google Colab code snippet: Creating new data frames for all sentiments (positive, negative and neutral)
tw_list_negative = tw_list[tw_list["sentiment"]=="negative"]
tw_list_positive = tw_list[tw_list["sentiment"]=="positive"]
tw_list_neutral = tw_list[tw_list["sentiment"]=="neutral"]
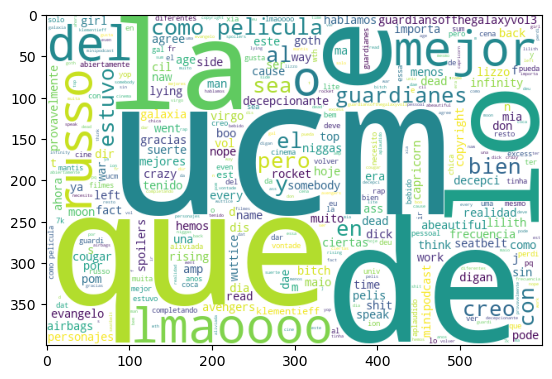
Sentiment Analysis for word: “UCM”
Positive Sentiment for word: “UCM”
Negative Sentiment for word: “UCM”